
Ripple’s XRP price increased massively on July 13, reaching a new yearly high of $0.938. This was the highest price reached since April 2022.
The increase was likely fueled by positive news regarding the Ripple vs SEC case. On Thursday, major exchanges such as Coinbase and Kraken re-listed XRP.
This occurred after Judge Analisa Torres announced that Ripple’s sale of its token on public exchanges did not violate securities laws.
However, the legal battle is not over yet, since the same judge also stated that the company contravened federal law when selling XRP directly to investors. So, Ripple is still on the hook for nearly $729 million in sales.

The XRP price has not reached $1 yet. Will it do so in the near future? Read below to find out.
Ripple Doubles in Value in a Single Day
The XRP price has traded below a descending resistance line since March 29. The line caused numerous rejections, the most recent on June 22.
However, on July 13, the XRP price increased by 100%, breaking out from the resistance line and reaching a new yearly high of $0.95 in the process. As outlined above, the breakout was aided by the positive verdict in the Ripple vs. SEC case, which most of the crypto community lauded. This confirmed that the correction is complete.
The price fell slightly afterward and is now trading below the $0.87 horizontal area, which provides resistance.
In any case, the daily RSI supports the continuing increase. Traders utilize the RSI as a momentum indicator to assess whether a market is overbought or oversold and to determine whether to accumulate or sell an asset.
If the RSI reading is above 50 and the trend is upward, bulls still have an advantage, but if the reading is below 50, the opposite is true. The RSI is increasing and is above 50, both signs of a bullish trend.
However, it is worth mentioning that the daily RSI is in extremely overbought territory, which could lead to a temporary drop and reset before the resumption of the increase.
Can XRP Price Reach a New All-Time High?
Similarly to the daily time frame, the weekly outlook for the XRP price also shows a bullish development. The price has broken out from a long-term descending resistance line that had been in place for 700 days. This supports the legitimacy of the breakout from the shorter-term daily time frame.
Also, the weekly RSI supports the legitimacy of the breakout since it is above 50 and increasing.
As outlined prior, the XRP price currently trades below the $0.87 horizontal area. While this is more than 250% below the all-time high of $3.30. However, it is worth mentioning that if the price manages to clear this level, the only other resistance before the all-time high will be at $1.70.
As a result, it would be possible for the price to quickly increase towards it if it manages to close above $0.87 in the weekly time frame.
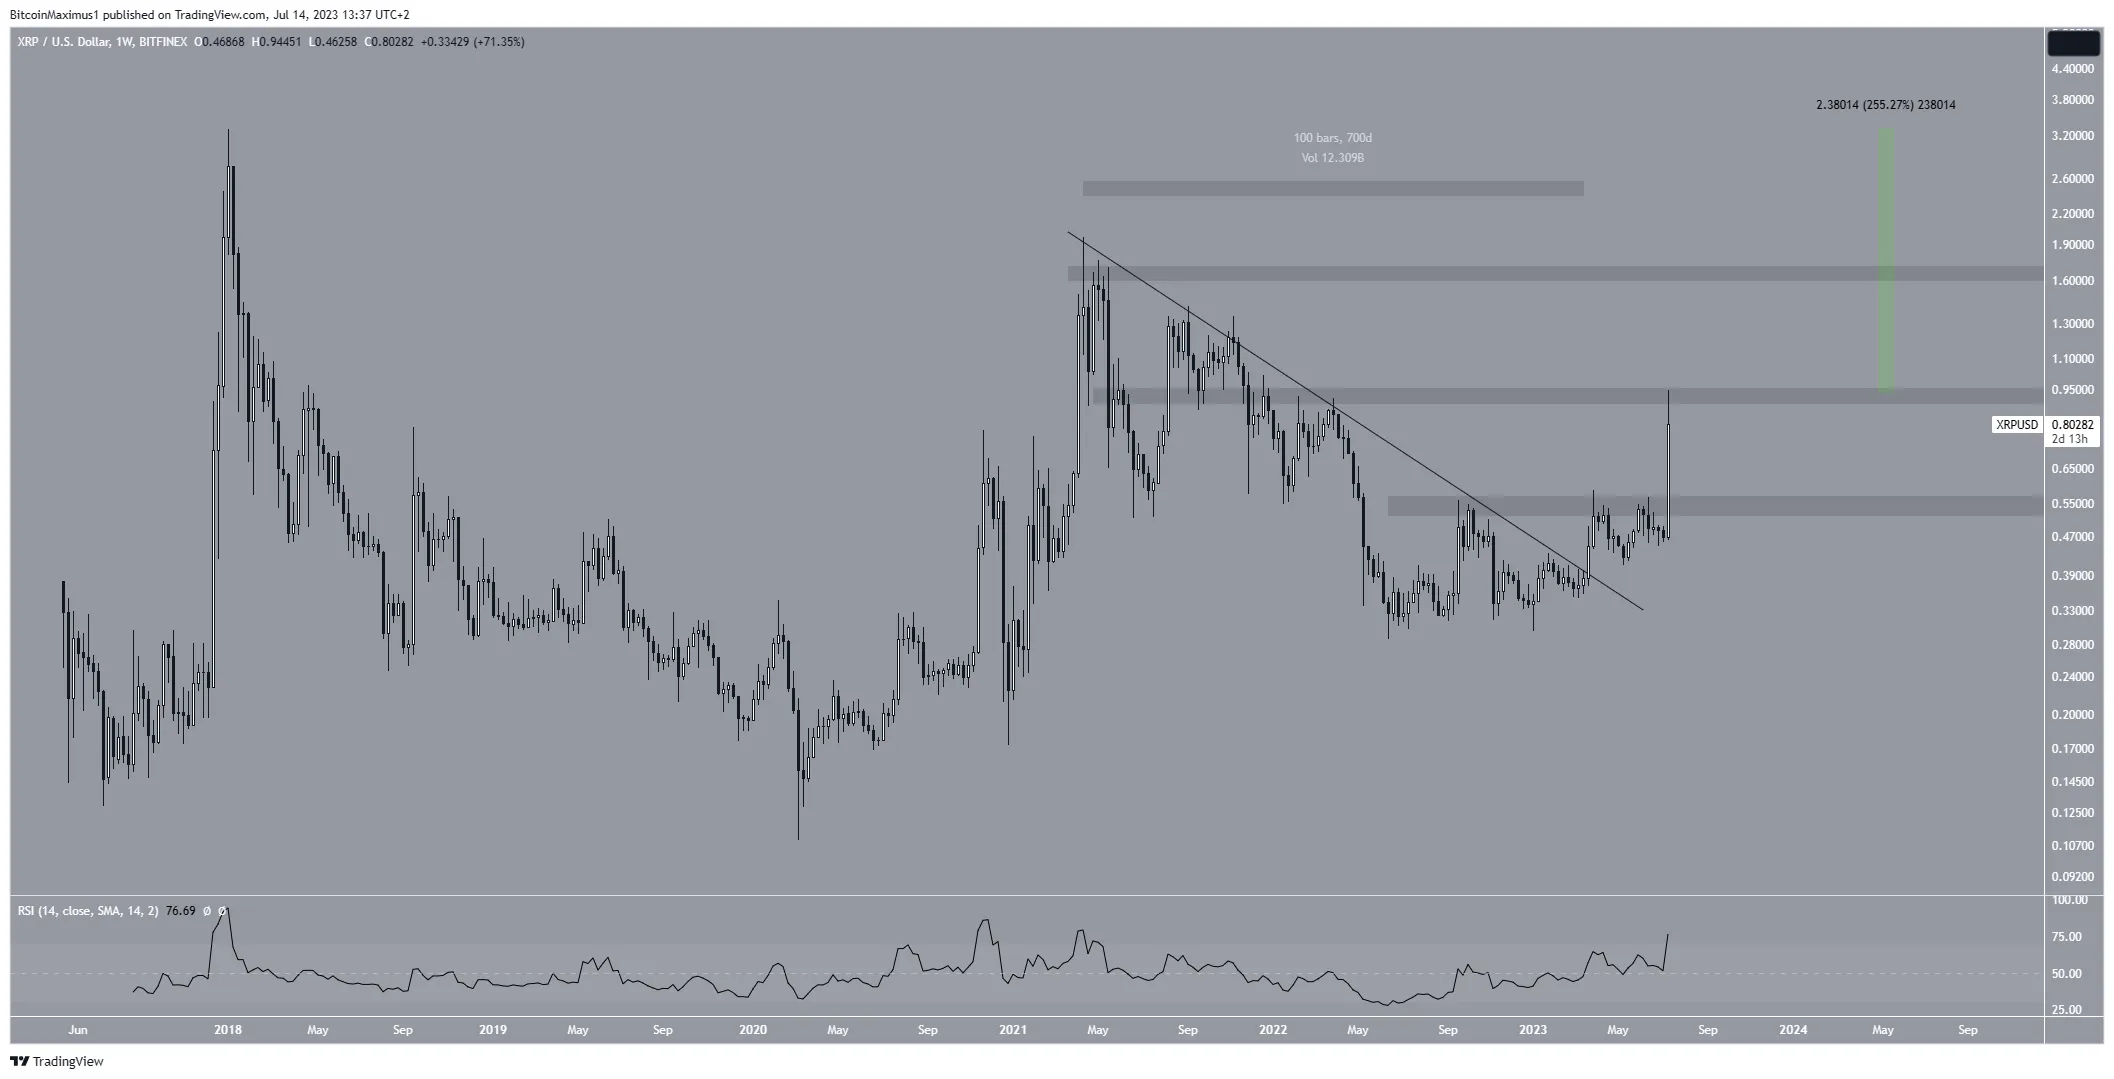
However, despite this bullish XRP price prediction, failure to close above the $0.87 resistance area can lead to a significant retracement. If that occurs, the XRP price could fall to the next closest support at $0.55.
For BeInCrypto’s latest crypto market analysis, click here
Disclaimer
In line with the Trust Project guidelines, this price analysis article is for informational purposes only and should not be considered financial or investment advice. BeInCrypto is committed to accurate, unbiased reporting, but market conditions are subject to change without notice. Always conduct your own research and consult with a professional before making any financial decisions.